Research
Peak height distribution of non-stationary Gaussian random fields
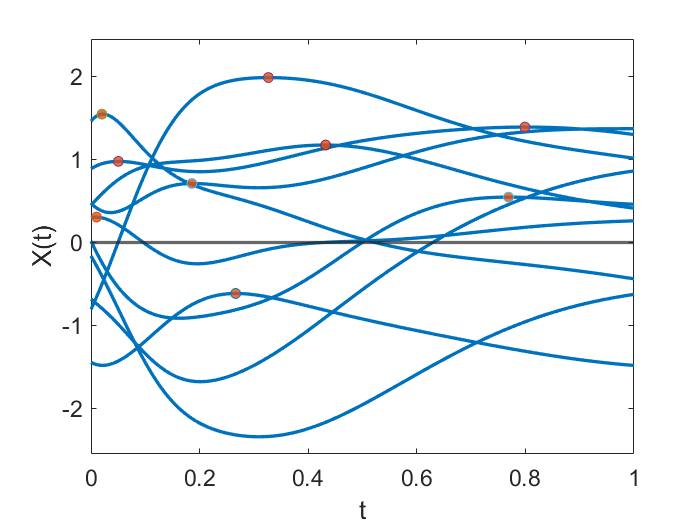
- Derive the explicit peak height distribution of smooth, non-stationary Gaussian processes in 1D with general covariance.
- Explore statistical properties of scale space fields, which play an important role in peak detection by helping to handle peaks of different spatial extents.
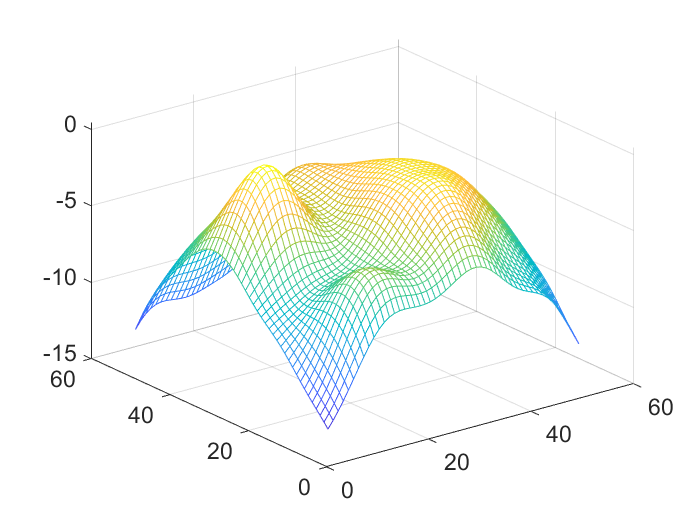
- Propose two efficient numerical algorithms as a general solution for computing the peak height distribution of smooth multidimensional Gaussian random fields in applications.

An approximation to peak detection power using Gaussian random field theory
- Provide new insights into random field theory (RFT) based power approximation formulas for peak detection.
- The approximation is based on the expected number of local maxima above the threshold $u$, $\text{E}[M_u]$, and proved to work well under three asymptotic scenarios: small domain, large threshold, and sharp signal.
- Explicit formulas are derived when the noise is modeled by a smooth isotropic Gaussian random field and the mean function is rotationally symmetric.
- Validate the methodology through simulation in MATLAB, and applied to real fMRI data from Human Connectome Project (HCP).

The chronic progressive repeated measures (CPRM) model for longitudinal data
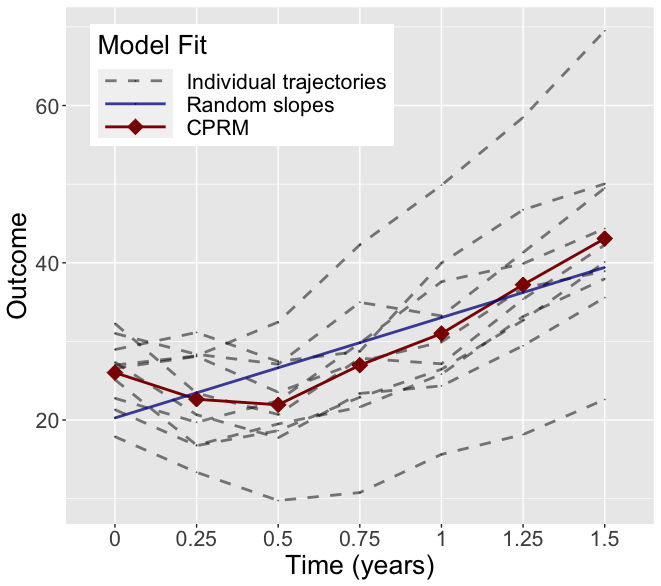
- Describe a parsimonious covariance structure for repeated measures analysis when the MMRM model with unstructured covariance fails to converge.
- Demonstrate with computer simulations that alternative parsimonious MMRM covariance structures perform poorly for chronic progressive conditions.
- Derive power calculation formulas for the CPRM model that have the advantage of being independent of the design of the pilot studies informing the power calculations.
- Implement the power formulas in R package longpower and R shiny app.
Professor Steven Edland presented our work at JSM 2022.

Power formulas for mixed effects models with random slope and intercept comparing rate of change across groups
- Derive power formulas for longitudinal studies accommodating differences in length and interval between longitudinal observations, different allocation ratios, and different subject missing pattern across groups.
- Illustrate the formulas could be used to power future study with arbitrary design.
- Implement the power formulas in R package longpower and R shiny app.
I had the opportunity to present this work in an oral presentation at JSM 2020.

